

E-Book
Qualitative Data and Analysis in Institutional Research
Abstract
Qualitative data directly reflects some of the most complex and dynamic issues students and employees encounter, which is incredibly valuable for institutions to make continuous improvement. The Mānoa Institutional Research Office (MIRO) brings qualitative data into daily institutional research practices through regularly collecting qualitative data and efficiently disseminating it through a series of homegrown interactive web app tools.
Introduction
The Mānoa Institutional Research Office (MIRO) has always sought to support university decision-making for institutional effectiveness by making meaningful and actionable data more accessible among faculty, staff, and administrators. MIRO provides all kinds of data and analysis through the office’s internal decision making system and MIRO’s website. But what does the data really mean and what actions can people take by looking at numbers alone?
Over the years, MIRO staff noticed that numbers can tell users why certain trends exist but they don’t necessarily explain why the trends happened in the first place. More importantly, numbers usually don’t tell decision makers how changes should be made, which ends up limiting the amount of actions data users can make. Anyone can make theories and speculations when looking at the numbers, but if data doesn’t lead to actions, then how meaningful is the information institutional researchers provide to decision makers? MIRO started asking these questions after reflecting whether the office was offering Mānoa decision makers sufficient meaningful data to act upon.

(Corresponding Video Here)
There was a major breakthrough in 2016 that completely changed MIRO’s understanding of–and attitude towards–qualitative data when the MIRO director, Dr. Yang Zhang, led a small team of Mānoa faculty and staff at the Teaching and Learning National Institute (TLNI) conference at Evergreen State College.

(Corresponding Video Here)
Concerned about insufficient data available, MIRO conducted a short Supportive Environment Survey for Mānoa Students prior to the workshop. Because it was the first MIRO survey that was mainly composed of open-ended questions and was conducted during the summer break, it was not expected that students would take the time to write their answers. To MIRO staff’s great surprise, responses started pouring in as soon as the survey opened; many students thanked MIRO for asking open-ended questions because they felt supported simply by the opportunity to freely state their thoughts and share their experiences. This valuable data gave the UH-Mānoa members great insight when the team drafted an actionable plan for a supportive campus environment. Students’ positive feedback to open-ended questions also gave MIRO a new perspective towards how to survey students in the future.
During the TLNI workshop, UH Mānoa team members bonded with each other when sharing about their work responsibilities, what their experiences were, what made them happy, and what they struggled with. This helped our MIRO staff realize how important it is to listen to and understand an individual’s experience. As one of the TLNI team members described it, relations are at the core of everything because we all have shared human experience to connect over. TLNI became the starting point for MIRO’s qualitative data journey, because it led MIRO to ask how the office could transform those individuals’ experiences into data that decision makers could use to build trust, improve understanding, guide actions both among and within our campus community, and it.

(Corresponding Video Here)
For a small IR office serving a large campus, MIRO does not have the capacity to conduct popular qualitative research methods like in-depth interviews and focus groups. To effectively gather more individual experiences from a large number of survey respondents, MIRO chose to collect qualitative data through open-ended survey questions.
Qualitative Data Web Apps
In 2016, MIRO conducted a Supportive Environment Survey that mainly contained open-ended survey questions and gathered thousands of student comments. Once data was collected, a new challenge arose: how could a small IR office efficiently organize the large amounts of qualitative data and deliver relevant information to hundreds of offices and programs? It wasn’t possible for a team of three full-time staff members to customize reports for so many offices.

(Corresponding Video Here)
Dr. Yang Zhang transformed her dissertation method of analyzing large amounts of open-ended survey data and the “theme and indicator” data structure, to a solution of processing and disseminating large scale qualitative data of students’ feedback. Using MIRO staff’s expertise of programming and natural language processing, which is the branch of artificial intelligence that gives computers the ability to understand text (IBM, 2020), MIRO developed a series of home-grown web apps and standardized procedures that can make qualitative data processing and disseminating as efficient as possible.
MIRO has a unique advantage in creating innovative solutions of processing large scale qualitative data because the office has a unique strength of expertise in natural language processing and all the staff members working in the office at that time happened to have training and degrees in linguistics.

(Corresponding Video Here)
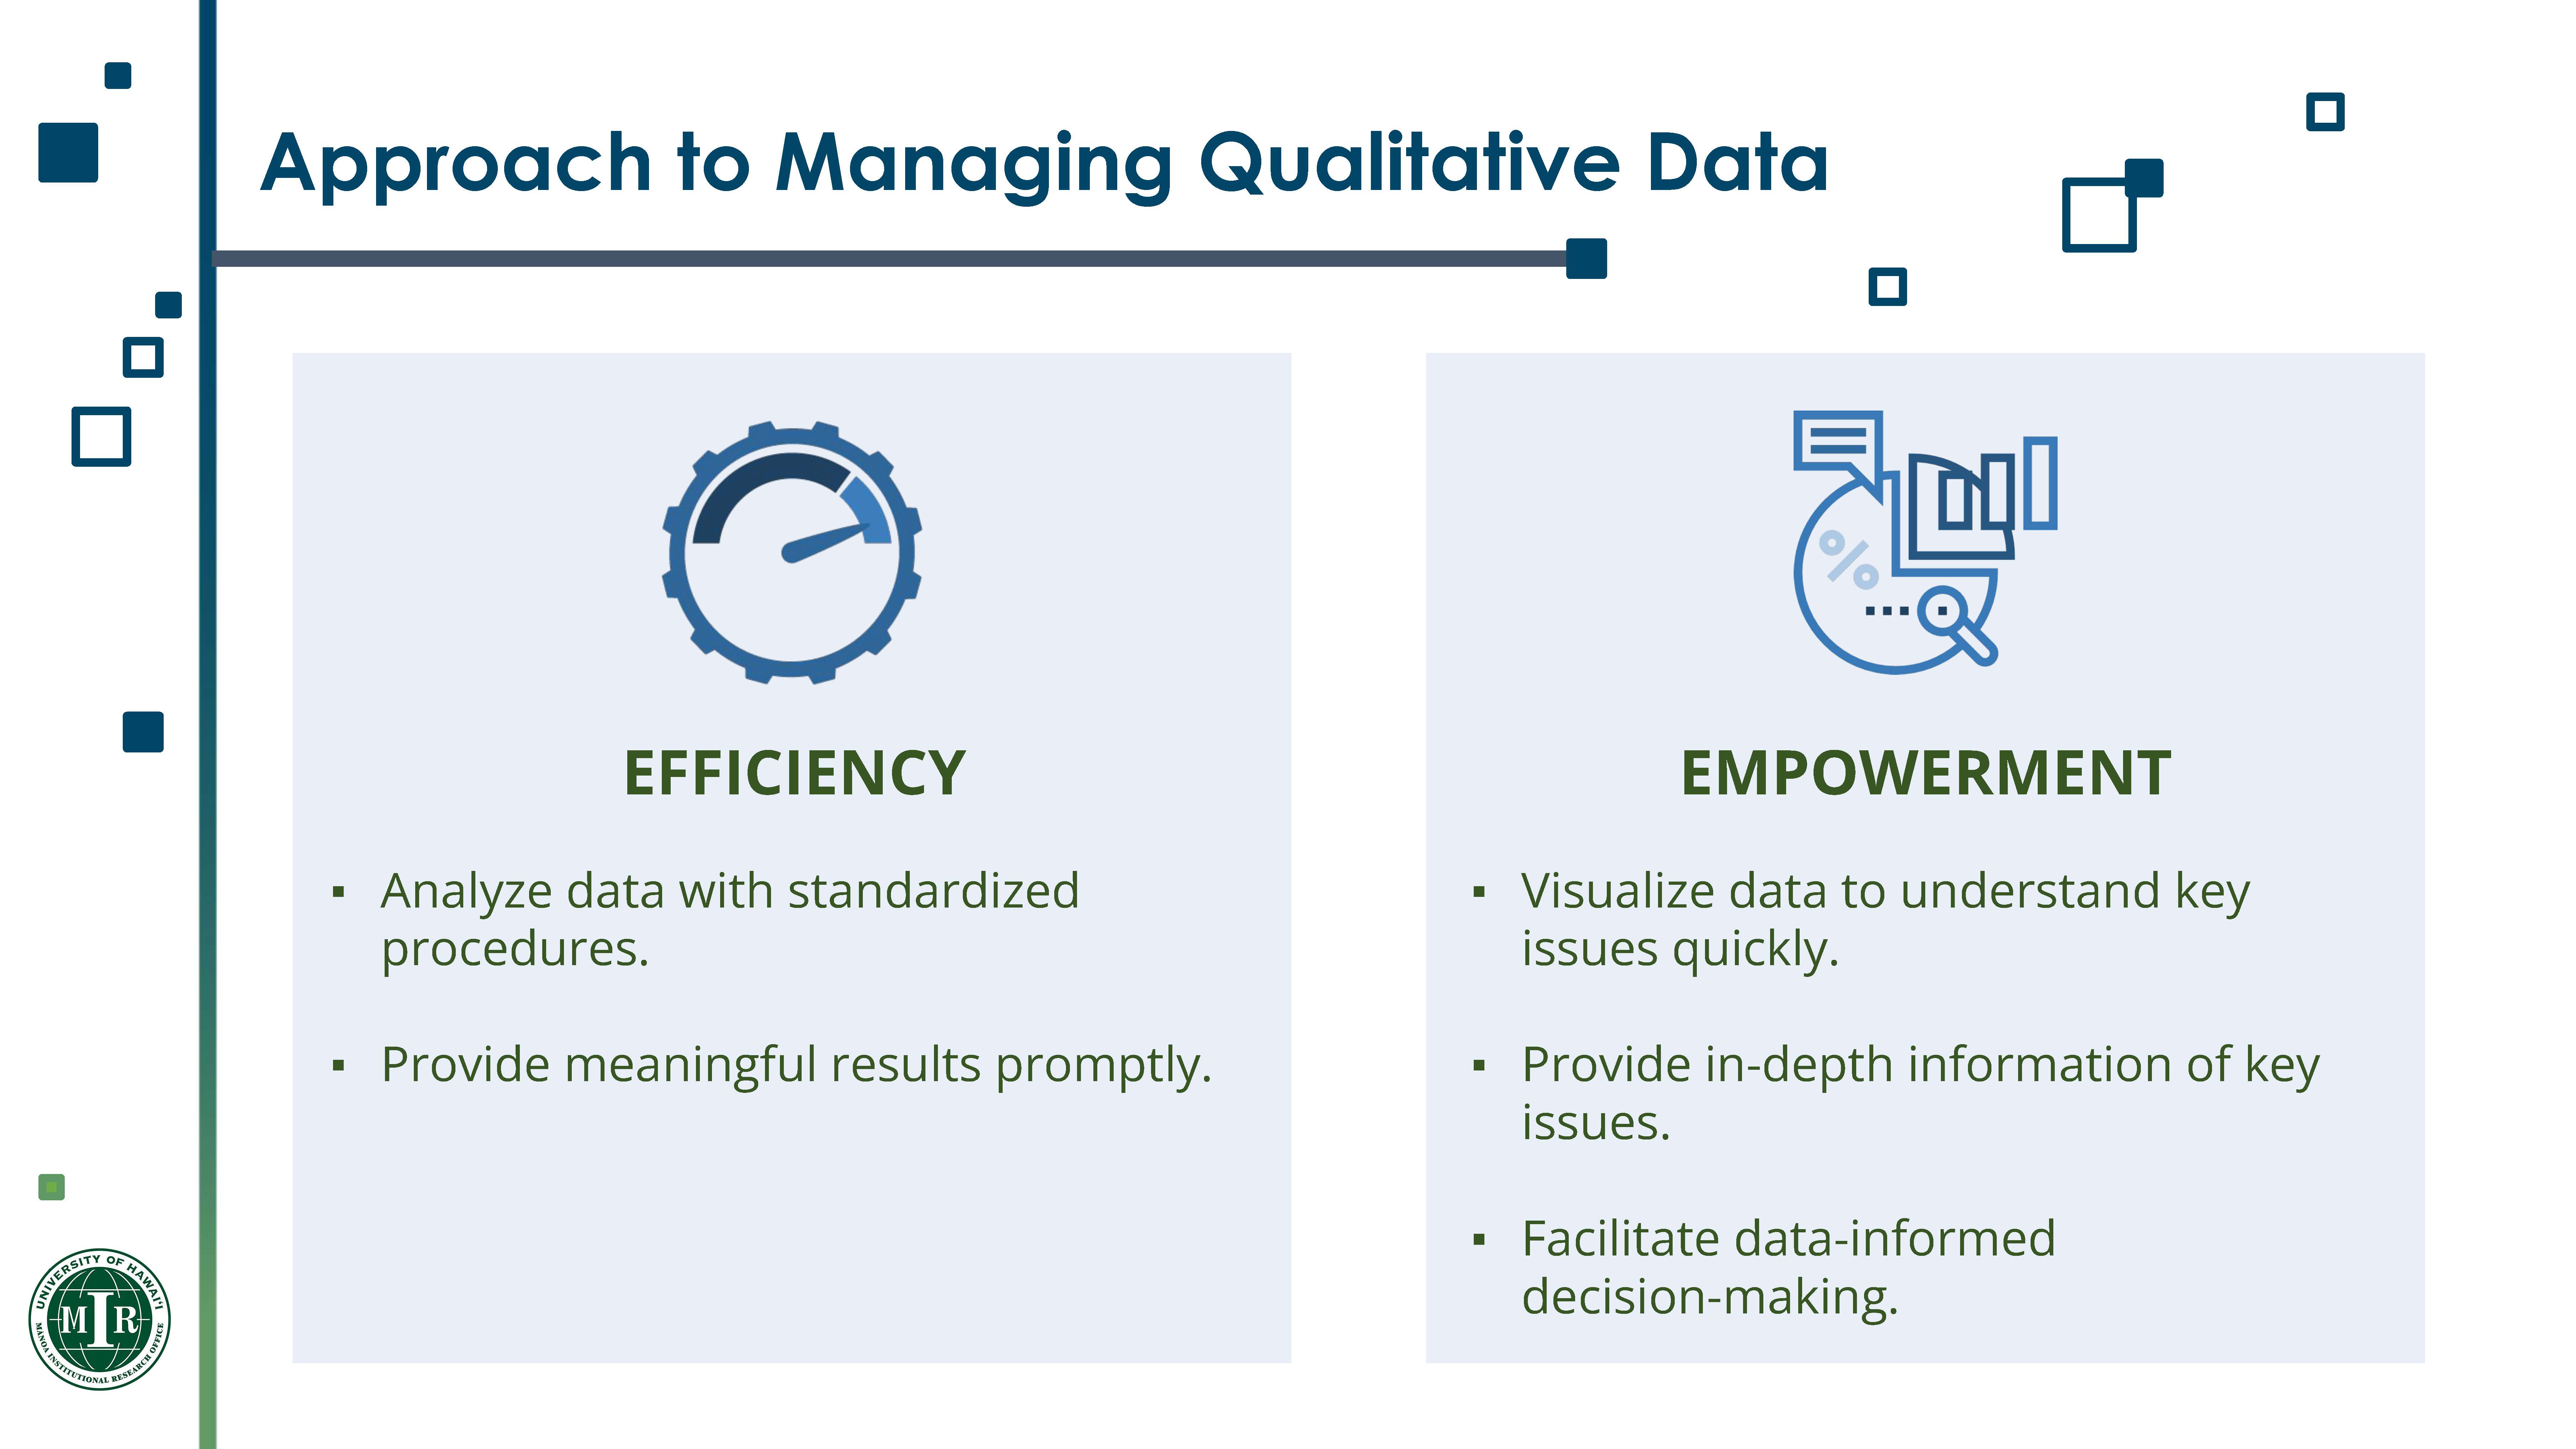
MIRO also hoped to empower decision makers by visualizing data to understand key issues quickly, providing in-depth information of key issues, and inspiring changes and actions by highlighting students’ voices. Focusing on those goals, MIRO’s qualitative web apps were designed to have three main components:
- a keyword reservoir that would read comments by using the Grounded Theory, a methodology that uses comparative analysis to discover or construct theories from the data itself, to pick out new keywords when they appear.
- a theme-and-indicator framework where similar keywords are organized by indicators, where similar indicators are grouped by themes, and where each theme and indicator is clickable for users to read all relevant comments.
- a way to display the open-ended survey data in a visually appealing manner, including colorful charts and word graphs.

(Corresponding Video Here)
Qualitative data analysis can be a heavy workload, especially for small IR offices. The key to solving this problem relied on advanced programming to do the work. Many filters were also included in the web app to allow users to quickly narrow down the responses only to groups of students they were interested in.

(Corresponding Video Here)
Everything seemed to be on the right track, but unexpected issues arose: some responses contained profanity and other inappropriate words, some showed errors and obscured characters which could affect the readers’ experiences when seeking information, and some respondents shared detailed and personal information which presented confidentiality concerns.

(Corresponding Video Here)
It would be too time consuming to manually address each situation, so MIRO created a list of the various types of profanity and made an automatic auditing program to identify and convert the inappropriate words into more neutral expressions.

(Corresponding Video Here)
Another issue MIRO faced was that survey responses downloaded from SurveyMonkey sometimes contained strange characters caused by errors within the file’s text encoding. For example, Hawaiian language diacritical markings were often obscured because they were considered “special characters.” MIRO used programming to identify and resolve these text errors once for all.

(Corresponding Video Here)
Many students want to share their personal experience, but some responses contain detailed information such as names, locations, and specific situations which may identify the person who made the comments. To protect the confidentiality of both the survey respondents and individuals who are named in the responses, MIRO used Natural Language Processing (NLP) to identify names or words in survey responses, then manually reviewed this shorter list to determine which entries contain names and convert them into neutral or unidentifiable expressions.

(Corresponding Video Here)
To keep important information while protecting respondents’ confidentiality, MIRO staff conducted data conversions where people’s identity could be disclosed. For example, the name “Dr. Smith” can easily be converted to “A Professor,” and inappropriate words can simply be filtered and removed.

(Corresponding Video Here)
Although new procedures can automatically capture inappropriate words or comments that may disclose one’s identity, they cannot capture every situation. To this day, the MIRO staff still needs to read each comment to address the data issues that are not picked up from the programming in case they find important keywords that were not identified earlier. Regardless, programming is an important tool that helps work be more efficient.
Design the Qualitative Web Apps
Once the Supportive Environment Survey web app tool was released, many colleagues submitted their feedback and found it helpful. Different offices started approaching the Mānoa Institutional Research Office asking to continue conducting this campus-wide survey. In 2017, MIRO expanded the survey with more open-ended questions and named it the “Campus Experience Survey.”
In 2018, the survey expanded again to include employees. In the same year, inspired by one of MIRO’s presentations, the Sustainability Office proposed a collaboration with MIRO on an Earth Day Survey, which would collect both quantitative and qualitative data on how the UH-Mānoa community thinks about sustainability and climate change issues. MIRO helped to design the survey and administer it to all employees and students.
While creating the Earth Day Survey web app, it was clear that the theme and indicator framework used for the students’ college experiences didn’t apply to the Earth Day Survey data. Similar situations occurred when MIRO created an web app to disseminate qualitative data collected from the employees’ Campus Experience Survey.

(Corresponding Video Here)
Knowing that the office lacked sufficient knowledge and experience to develop specific theme-and-indicator frameworks for those new surveys, MIRO relied on campus partners who have specialized knowledge and who are interested in seeing and using the survey results. The office then conducted multiple sessions and met with campus collaborators to read comments and create new theme-and-indicator frameworks. Once the frameworks were established, it was easier to develop new web apps to disseminate data from the Earth Day Survey and the employees’ Campus Experience Survey.

(Corresponding Video Here)
After releasing data of these two surveys, feedback poured in generously and many people suggested administering those surveys regularly. The surveys were continually conducted over the years while correlating web apps were released to display the survey results. Soon after, another setback occurred: users had to filter through multiple survey web apps and select each question to look for relevant comments. It was doable, but took too much time for repetitive work.

(Corresponding Video Here)
MIRO’s solution was to create a Combined Survey web app that would allow users to see related comments from all surveys that contain open-ended survey data. This web app contains different theme-and-indicator frameworks and demographic/academic background filters where users can look at the same data using different lenses of frameworks and narrow down comments from the populations they’re interested in.

(Corresponding Video Here)
While working with the data users, MIRO noticed the framework may not include keywords that are meaningful to different users. So, the office created another web app that would allow users to search for any word in all of the survey results. This way, users can search for words that are meaningful to them that are not included in MIRO’s keyword database.

(Corresponding Video Here)
MIRO’s qualitative survey web apps are mostly found in the section titled “MIRO survey” on the Decision Support System. The only exception is the NSSE “Additional Comments” web app, which is under the “NSSE data” section. This web app disseminates the open-ended survey data collected from the NSSE survey. All the homegrown surveys that MIRO conducts are mostly composed of open-ended questions–this shows how firmly the team believes in the importance of qualitative data. Knowing how valuable qualitative data is, MIRO created different web apps to help users get the most out of all the data collected. So in the Decision Support System, users will see a series of Earth Day surveys, Campus Experience surveys, as well as the Combined Survey web app that allow users to view relevant comments from every survey conducted, and the Search Keywords web app to search any word of the user’s choice.
MIRO’s qualitative data web apps are quite similar in design, so the 2018 Campus Experience Student Survey web app will be used as the main example. This survey asked six open-ended questions and one yes-or-no question, and all questions are under the dropbox labeled “question.” Users can select one question at a time to see the results. The default survey selected is “why the fall 2018 is not going well.” The survey offers dozens of other background filters for users to choose from, which are helpful for users to quickly narrow down students’ feedback to the group that they are most interested in (see Figure 18).
This example also explores the college experience for undergraduate students who come from the continental U.S., and the selected question asks why their semester was not going well. First, there is a table of contents that has a column of themes and a column of indicators–this is the theme-and-indicator framework mentioned earlier. The table also shows that UH-Mānoa received 589 total responses from undergraduate students who moved to O‘ahu from the continental United States. The numbers seen after each theme and indicator represent the number of comments and keywords that fall under those categories.

(Corresponding Video Here)
Under the table of contents, there’s also a WordCloud graph, which can quickly display the most-frequently mentioned keywords. In Figure 19, it is evident that undergraduate students from the mainland mention “expensive” the most, which makes sense because many students pay out-of-state tuition and Hawai‘i has one of the highest living costs in the world.

(Corresponding Video Here)
In addition to the WordCloud graph, there is a bar chart to show how the selected student group answered the question of whether they would choose to attend UH Mānoa if given the chance to start over (see Figure 20). This information indicates the satisfaction rate of the selected group and can be used as a helpful reference. In this case, we can see that the percentage of mainland students who answered “yes” or “maybe yes” is slightly lower than the university’s average.

(Corresponding Video Here)
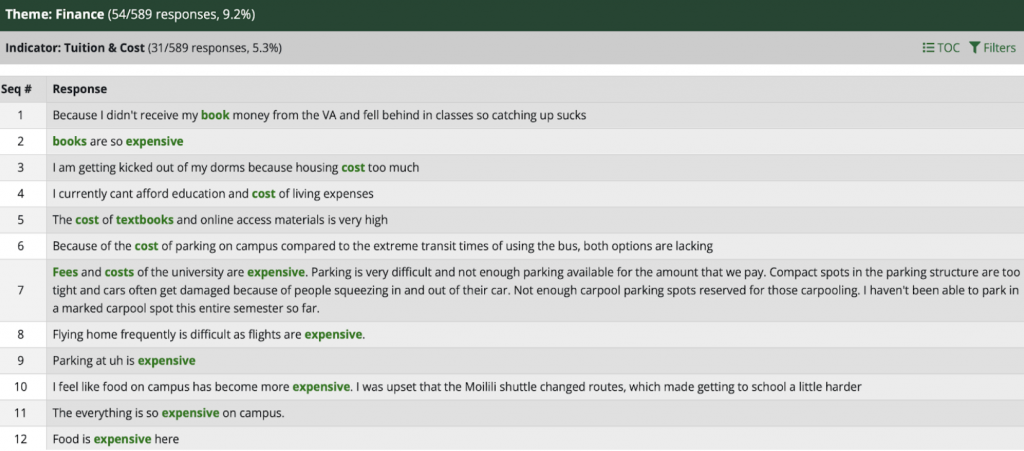
Under the bar chart are the students’ comments, also organized by themes and indicators, and are the most important features of the web app. Readers can choose to read all the comments, or they can click the shortcut button labeled “TOC” on the right, and jump right back to the Table of Contents if they want to read a specific theme or indicator. The WordCloud graph shows that cost was the most concerning issue among mainland undergraduate students. We can further examine students’ comments on affordability and cost by clicking the theme “finance” in the Table of Contents. Users will see a list of relevant comments that include green colored keywords that are associated with the theme “finance” (See Figure 21). Users can read all relevant responses at once and also see the percent of responses mentioning this theme and related indicators.
(Corresponding Video Here)
To make it easier to compare different student groups’ comments with each other, there is a “clone report” button. Cloning a report allows users to open a new window with the same selection of filters to then make changes on top of the previous selection. For example, by cloning the undergraduate student report, the geographic origin can easily be changed from “mainland” to “the state of Hawai’i,” making it easier and quicker to compare data of two student populations. From the new Word Cloud graph (see Figure 5), although expenses are still a main concern among students from the State of Hawai’i, “parking” is now the top keyword. This may have happened because a higher percentage of local students commute to school and have more challenges with parking.

(Corresponding Video Here)
To see how qualitative data provides powerful information to help gain in-depth understanding about specific issues, the following quote is from how an undergraduate commuting student described their experience of finding parking.
“Having class at 8:30AM, heading from [a location far away], it is required to wake up at 6:00am because of the BUMPER to BUMPER traffic that takes an HOUR and 30 minutes. I cannot take more than 25-30 minutes to head out. I would not get to [a Location hidden] until 7:35AM if I do not get up at 6am. Otherwise I would miss the shuttle that stays until 8am and be stuck there until 8:30. So I have been missing a good part of my Calculus lecture.”
Oftentimes, students mention multiple issues at once. Their comments give data analysts a better understanding of how different issues could affect student college experiences together. In the student’s comment, it’s clear some of the main concerns are commuting times in conjunction with being a student while managing classes, safety, financial stability, and rest. The content in brackets are converted by MIRO staff from words that are either inappropriate to display or words that could potentially reveal the respondents’ identity.
Combined Survey Web App
One of the advantages of the open-ended survey data is to help understand whether a program or initiative works and how to make improvements, which is hard to accomplish using quantitative data. At the University of Hawai‘i at Mānoa, there is an award-winning degree audit software program called STAR, anecdotally known to play an important role in improving 4-year graduation rates. But how, one might ask?
As mentioned earlier, MIRO created a Combined Survey web app to retrieve qualitative data from different surveys conducted. After selecting the indicator “STAR,” users can quickly see that students share how the STAR program helped them in their college journey. For example, in the 2016 survey, a student said, “I appreciate the STAR system to follow my progress and check grades… I sincerely appreciate the STAR scholarship program. It really simplifies finding and completing online scholarship applications.” Another student said, “The STAR system is an excellent tool for students to see their progress on their degree program and to explore other degree options.” Another student also said, “I love the STAR website because I can see what classes remaining I need to take.”
Of course, students also give suggestions and recommendations to improve the STAR system. Both positive and negative comments are helpful because they tell the university what works and what doesn’t. This is the beauty and power of qualitative data.
“The most impressive experience that I have had was with my practicum professor. Dr. Yontz was unbelievably professional, supportive, encouraging and helping. With her assistance, I was able to successfully complete my practicum with limited resources and a restricted schedule. Big mahalo to such a student-center professional like her!”
By reading students’ comments, MIRO got to know about many wonderful colleagues such as Dr. Yontz. Qualitative data tools are a special and unique way to highlight and encourage the amazing colleagues and their best practices at UH-Mānoa. These aforementioned examples merely skim the surface of this deep sea of rich and actionable qualitative data. We cannot emphasize the importance of qualitative data enough to our faculty, staff, and researchers, as they could do an amazing job in improving understanding and building trust, and hence can bring fundamental changes to our understanding and viewpoints about many important issues at work and in life.
Make Use of Qualitative Data
MIRO’s open-ended surveys and data tools have proven to be helpful and useful, but how do we spread the word so more people know about and utilize the available data tools?

(Corresponding Video Here)
Some of MIRO’s outreach efforts include conducting presentations, inviting colleagues to feedback reading workshops, advocating the need for qualitative data at important meetings, and introducing the tools and data when responding to data questions that cannot be answered by numbers alone.
MIRO has also taken a more-specialized approach on a need-by-need basis. For example, MIRO staff met with UH-Mānoa transfer advisors in summer 2019 and walked them through the qualitative data web apps and read comments together. During the 3-hour process, advisors were inspired by comments from transfer students and came up with ideas on what to change, making action plans immediately. Through that discussion, the MIRO staff also gained valuable field knowledge from the advisors. This helped improve the theme-and-indicator structure and MIRO gained greater understanding of how to work with offices on qualitative data projects.

(Corresponding Video Here)
Through these collaborations, MIRO learned that the Earth Day survey data was useful not only to the sustainability office, but also for colleagues who do facility and building planning. Using the qualitative data collected from the Earth Day Survey, the Sustainability Office successfully gained the board of regents’ support to double the amount of water fountains on campus.
MKThink, a consulting firm that helps UH Mānoa conduct facility planning, heard about the qualitative data MIRO collected, then reached out for employee and student feedback on various classroom, lab, and library renovation projects, and used qualitative data in various university transition efforts. Josh Jackson, former Senior Associate at MKThink said,
“MKThink is assisting the University of Hawai‘i at Mānoa in the production of a “Framework for the Future” — a vision that will guide campus growth & transformation. The Student Experience Survey provided an opportunity for us to “query” the student body without actually initiating our own engagement effort. Starting with the MIRO data tools, we were able to use Natural Language Processing, word frequency analysis, and other methods to “ask” students about housing, social activities, and a plethora of other topics that we needed to inform the Framework plan. The data tools shared by MIRO enabled us to glean a tremendous amount of knowledge from the UH Mānoa student body that we otherwise would have struggled to learn. In other words, the Campus Experience Survey and MIRO’s data tools helped to give students a greater voice in campus planning activities that would have otherwise been impossible.”
MIRO’s Campus Experience Survey has also been of great assistance to the CampusHelp office. This office often receives calls from the community and other visitors inquiring about the campus and directs them to the appropriate offices for answers. They used MIRO’s open-ended surveys to ensure the best campus experience possible, and improve the ways they address student questions and concerns. The CampusHelp director Ann Sakuma said, “the campus experience survey is a good gauge on what is successful and where there are areas that need further attention.”
MIRO also learned that the employee’s Campus Experience survey was very helpful for the university’s Conflicts and Solutions officer:
“I attended a presentation given by Yang and her work was like a lightbulb went off for me because the data she’s collecting aligns with the information I need in order to design better initiatives to support a healthier campus environment… The qualitative data is much broader and richer. It’s more nuanced, and it’s really the kind of information and data that I’m looking for to drive my decision making and my work in my office.”
Closing Remarks
The possibilities of using qualitative data for positive change are endless, but the challenge of analyzing a large amount of qualitative data is real. This is why MIRO considers the qualitative data web apps to be one of MIRO’s most innovative works. The office started from scratch and had many roadblocks along the way. Creativity and innovation were needed to overcome each roadblock and, as a result, MIRO now has tools that can help Mānoa faculty and staff quickly locate helpful information regarding the topics that they are interested in.
(Corresponding Video Here)
We at MIRO are proud of what we have created and are thrilled for the endless possibilities of changes that qualitative data and tools will bring. Over the past few years, we have seen significant benefits from everyone’s hard work in collecting qualitative data.
- Qualitative data can be used to examine certain phenomena or issues that are hard to measure by numbers such as campus culture, diversity and inclusion, and motivations behind certain behaviors or choices.
- Collecting narratives from faculty and students helps “connect the dots” for quantitative data. This, in turn, can help researchers better interpret and use quantitative data.
- Qualitative data can help institutional research discover issues that might have otherwise been overlooked. It is also a great way to explore new issues that researchers are unfamiliar with, especially regarding emerging issues like the impacts of the global pandemic to our university.
With real life narratives, it allows institutional researchers to develop solutions that are tailored to a particular issue or program, through the examination of survey respondents’ thoughts, feelings, and experiences.

(Corresponding Video Here)
MIRO wouldn’t have been able to build these tools without partnering and collaborating with the Mānoa community. People’s voices matter, and we hope these resources will encourage our campus community to engage with student feedback and create positive changes.