


E-Book
IR Support for Academic Program Review
Abstract
The Mānoa Institutional Research Office (MIRO) transformed a tedious and manual process of data preparation to an interactive online data tool that provides more timely, comprehensive, and accessible data to programs that are under review. Additionally, MIRO’s approach of supporting the academic program review is not limited by a fixed dataset published on the Program Review web app, but rather emphasizes the importance of using a variety of web apps that can further address programs’ unique data needs.
Introduction
Supporting program reviews is a major responsibility for institutional research. Many offices– such as Assessment, Research Services, Advancement, and more–contribute to the program review data collection process; Colleges and departments themselves also provide some data for reviews. Most universities, however, often look to institutional research offices for the majority of data needed in the program review process.
In the past, the Mānoa Institutional Research Office (MIRO) prepared Program Review data in Excel files, but it was a tedious manual process. MIRO’s small, three full-time staff would pull and copy data by hand, but it was incredibly time consuming and had a higher risk of including errors due to the laborious process. On top of that, programs would only get their program review data once every five years when they were under review.
From A Manual Process to a Digital Programming Software
To make the process more efficient and to provide more timely data to programs, in 2019 MIRO decided to switch from a manual process to a homegrown digital programming software, thus the Program Review web app was born. Since then, MIRO has gradually released data each year for programs that are under review. Once released, the data will remain on MIRO’s web app and be regularly updated thereafter.
The web app includes ten years of data compared to five years in the previous Excel version. It also provides college-level reports as a reference, which was not included in the original Excel reports. Not only does MIRO include more data and make the data more accessible, the office works hard to help colleges and departments use our data tools by actively meeting with programs or by hosting training sessions.The Program Review web app is located in the section “Comprehensive Reports” of MIRO Decision Support System, a centralized data platform where UH Mānoa’s faculty and staff have access to different types of data. This chapter will explore the design of MIRO’s Program Review web app and explain our thinking process behind it.
Web App Filters
The interface design of the program review web app is quite simple and straightforward (see Figure 1). If users prefer to see data for undergraduate or graduate students only, they can specify that in the first column–the same concept applies for other filter features as well where users can simply click what they prefer to see. For the Program Review web app, there is a specific filter worth noting: the “college” filter. This filter allows users to look at the departments in a larger concept of colleges, and the department filter allows users to have a close-up look of the departments with detailed, major-level data.

The reason MIRO decided not to combine the two filters and have a three-level report design is because the program review report includes a lot of data; putting everything together could overwhelm users and discourage them from using the report. As an office that always pays attention to prioritizing user experience, MIRO separates the college-level and the department-level reports to make data easier to digest for the users.
Web App Features and Design
Once a user makes their selection and generates a Program Review report, they will see the following key data sections: enrollment, persistence, degree, time to degree, and courses (see Figure 2). Under “degrees,” MIRO includes the number of degrees awarded, the average credits earned, and average GPAs upon graduation. Under “Courses,” MIRO includes data of Student Semester Hours taken from courses offered by the department selected, the number of students registered for classes, the number of classes offered, and the average class sizes.

(Corresponding Video Here)
For users’ convenience, the left hand side has a navigation toolbar which allows users to quickly jump to the information they want to see (see Figure 2). Also, the toolbar remains visible while users scroll through the page to make it even easier for the users. MIRO also created a “Back to Top” link to bring the users to the top of the report, and included a “filters” link that can easily take users back to the filters, in case they want to select a different department or college to look at.
The report begins with a summary table of the past 10 years’ enrollment numbers grouped by the different degree programs, such as BA, BS, MLISC, MS, and Ph.D. Each undergraduate degree is broken down by the Lower Division and the Upper Division. Under the selected department’s summary table, each major’s data is presented in the same format (see Figure 3).

(Corresponding Video Here)
The second section on the Program Review Report is Year-to-Year, Department-Level Persistence Rate, which helps track how successful a department retains or graduates students within its department (see Figure 4). Each year, a cohort is formed from students who are enrolled in a particular program. The persistence rate of the cohort is calculated by identifying students who either (1) continue to enroll in or (2) have graduated from the same department one year later. This only includes classified students who are enrolled in degree programs.

(Corresponding Video Here)
The third section is about degrees awarded and includes three key data points: Degrees Awarded, Credits Earned, and GPA upon graduation. The number of Degrees Awarded is counted using all degrees awarded in a given fiscal year. If a student receives multiple degrees, all degrees are counted (see Figure 5).

(Corresponding Video Here)
The Average Credits Earned at graduation is calculated by taking the sum of all completed credits and dividing it by the number of students that graduated that year. A downward trend is more desirable as it reflects a more timely graduation. When a cell consists of only one person, the value is replaced by “SN” (Small Number) to protect individual identification. If there are no students to calculate the data from, then the cell will remain blank (see Figure 6).

(Corresponding Video Here)
The average GPA upon graduation is calculated by dividing the sum of all student GPAs by the number of students that graduated that year. An upward trend is desirable as it reflects a better academic performance (see Figure 7).
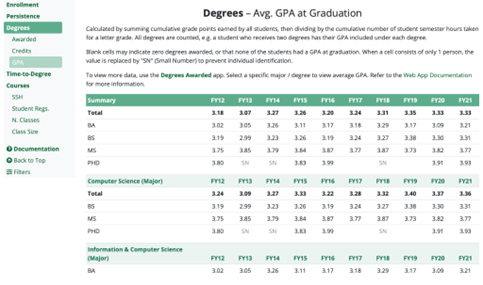
(Corresponding Video Here)
The Median Time-to-Degree (TTD), or Time-to-Completion, measures the number of years it takes for students to finish a degree (see Figure 8). MIRO uses the first-time full-time student data to calculate the undergraduate TTD number, and the graduate data comes directly from UH Mānoa’s graduate division office. The median TTD is recommended instead of the average because the average can be skewed if a sample size is small. To achieve consistent and comparable statistics across years, specific rules are applied to select students for calculation. In this case, a shorter time-to-degree is desirable because it means the university successfully graduates students in a timely manner.

(Corresponding Video Here)
The final section is about courses. Course offering is the core of teaching activities, so it is an area of focus in the program review dataset MIRO created. Four different data points are included in this section: Student Semester Hours (SSH), Student Registrations, Number of Classes, and Class Size (see Figure 9).
Student Semester Hours is calculated by multiplying the number of credits (or semester hours) assigned to a course for the semester, by the number of students enrolled in that class. MIROʻs report gathers the sum for Lower Division, Upper Division, and the Graduate Division; and further calculates the percentage taken by students in the same department, students from other departments in the same college, and students from other colleges.

(Corresponding Video Here)
Student Registration refers to the number of students registered for courses offered by the selected department. Data is also broken down in the same way as in the Student Semester Hours’ section (see Figure 10).

(Corresponding Video Here)
The last two data points are the Number of Classes offered and the Average Class Size. Course-level data calculations are made using data compiled by the UH system’s IR office’s course data (see Figure 11).

(Corresponding Video Here)
In the past, MIRO used to only provide department-level program review data. Over the years, we’ve received feedback from faculty members and administrators that it would be more helpful to include the college-level data as a reference. Overwhelmed by the tedious manual data preparation work in our previous program review data preparation practices, MIRO was not able to fulfill this need. When designing the Program Review web app, MIRO was able to add a filter labeled “college” that now allows users to see the same program review data from the college itself and its respective departments or majors. This is another example of programming making a huge difference to improving the efficiency and capacity of an institutional research office.
Data Help Page
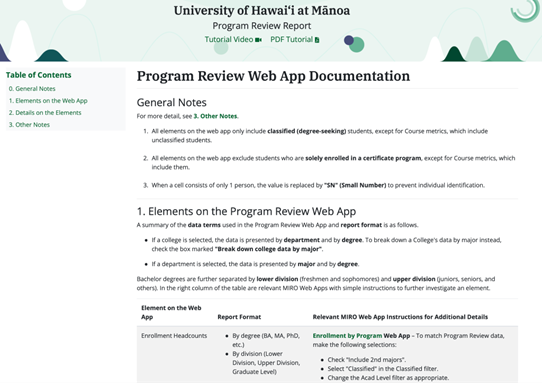
Some users may not know how data is calculated or how it should be interpreted, so MIRO created a tutorial video and PDF document to guide users through the web app’s features and key data elements. MIRO also created a Report Help Page, conveniently located at the top of the web app, that includes thorough information to help users better understand program review data, such as each data element’s source, calculation method, and a brief interpretation (see Figure 12). MIRO put a lot of effort in compiling information into the Help Page to make each report as well-explained and as transparent as possible.
(Corresponding Video Here)
Compared to the rich data available in MIRO’s dozens of web apps, data included on the Program Review web app is quite limited due to the length of the report. So on the Help Page and also on the web app report, MIRO provided links to relevant web apps where users can retrieve more data they need for the program review (see Figure 13).

(Corresponding Video Here)
Closing Remarks
MIRO’s Program Review web app relieves staff from the tedious manual work of report preparation and also gives easier and more accessible data for programs that are under review. Using programming to create and update the online interactive web app has proved to be a successful move for MIRO to improve efficiency in preparing program review data. This ultimately ensures that all program review data needed is ready for programs that are under review in a timely manner. Other than data included in the Program Review Dataset, more data is available on MIRO’s Decision Support System through other web apps, such as the Low Success Rate Courses, International Student Report, University and Program rankings, NSSE survey, College Experience Surveys, and many more. MIRO’s approach of supporting the academic program review is not limited by a fixed dataset published on the Program Review web app, but rather emphasizes the importance of using a variety of web apps to further address programs’ unique data needs.