Printer Friendly
Title
Ocean Temperature Profiles
NGSS Performance Expectations
NGSS PE Linking Sentence
The content and activity in this topic will work towards building an understanding of how unequal heading of the earth creates water layers that have different temperatures. Temperature causes density differences that affect ocean circulation.
Body
Sea Surface Temperature
Image caption
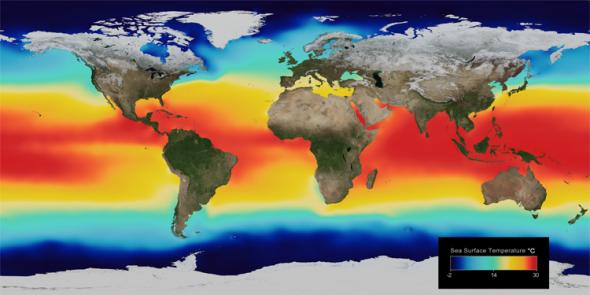
Fig. 2.8. Average global sea surface temperatures. Reds and yellows indicate warmer temperatures; blues and purples represent colder temperatures. The scale is in units of degrees Celsius.
Image copyright and source
Image courtesy of National Aeronautics and Space Administration (NASA)
Dense, cold water will sink when it comes into contact with less dense, warmer water. This sinking of cold, dense water affects the temperature of the ocean both at the surface and in the ocean depths.
The surface temperature of ocean water ranges from approximately –2˚C to 36˚C. The temperature can be colder than the freezing temperature of fresh water (0˚C) because the dissolved salts in seawater lower the freezing point. The lowest ocean surface temperatures are found near the North Pole and near Antarctica (Fig. 2.8). The highest ocean surface temperatures are found near the equator. This is because, on average, the sun’s rays are most direct at the equator and less direct farther away from the equator. We can see this concept demonstrated in Fig. 2.9. The yellow circles created by the three middle yellow lines represent the sun’s rays shining on the equatorial region. The area of each circle is small and concentrated. The larger circles at the north and south poles created by the top and bottom yellow lines show that the same amount of the sun’s energy is spread out over a larger area in the polar regions. Because the solar energy is less concentrated there, water at high latitudes does not get as warm as water near the equator.
Fig. 2.9. Each yellow line represents the same amount of the sun’s energy.
In Fig. 2.9, the yellow circle created by the middle yellow line between Australia and Indonesia is small and concentrated. This small circle shows that the sun’s energy is strong and intense near the equator. Larger circles at the South Pole and over Asia created by the top and bottom yellow lines show that the sun’s energy is spread out and weaker close to the poles. Water at high latitudes does not get as warm as the water near the equator.
Worldwide, the average temperature of ocean surface water is 17ЛљC. In comparison, the worldwide average temperature of all ocean water, from the surface to the seafloor, is 3.5ЛљC.
Water Layers
Water stratification is the process by which water in the ocean and in lakes forms layers based on differences in temperature and salinity. In the open ocean, water temperature and salinity vary with depth. Data from temperature probes lowered into the ocean and other bodies of water to create a vertical temperature profile show that the warm water surface layer often ends abruptly, with the temperature going rapidly from warm to cool. The thermocline is the zone where there is a rapid temperature change. The thermocline is also called a transition zone because it has characteristics of both the surface- and deep-water layers.
Activity
Make graphs showing vertical temperature profiles of the Pacific ocean basin.
Exploring Our Fluid Earth, a product of the Curriculum Research & Development Group (CRDG), College of Education. © University of HawaiФi, 2011. This document may be freely reproduced and distributed for non-profit educational purposes.


