Measuring Salinity
Salinity
Salinity is the measure of the number of grams of salts per kilogram of seawater, which is expressed in parts per thousand. Parts per thousand can be defined as how many parts, or grams, of salt there are per thousand parts, or kilogram (1,000 g), of seawater. The symbol for parts per thousand is вҖ°. The symbol for parts per thousand (вҖ°) is similar to the symbol for percent (%), which is parts per hundred, but with an extra zero in the denominator. Parts per thousand is commonly abbreviated as ppt.
|
|
Salinity Categories
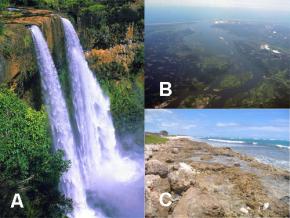
Fig. 2.12. (A) Wailua Falls, KauaвҖҳi, HawaiвҖҳi (B) Columbia River estuary, Oregon (C) BarberвҖҷs Point tide pools, OвҖҳahu, HawaiвҖҳi
The average salinity of seawater is about 35 grams per kilogram (g/kg) of seawater, or 35 ppt. Seawater generally ranges from 33 ppt to 38 ppt. Freshwater lakes, rivers, and streams contain some dissolved matterвҖ”1 ppt or less (Fig. 2.12 A).
Water is not considered pure unless it has been distilled. Distilled water has gone through the distillation process, which involves evaporating and condensing the water several times to remove dissolved matter. When water is evaporated, only water molecules escape into the air, leaving the heavier minerals behind. When the evaporated water is condensed, no minerals remain and the water is pure.
Brackish water is a mixture of fresh water and seawater, below approximately 33 ppt (Fig. 2.12 B). Hypersaline water, or brine, is very salty seawater, above approximately 38 ppt. It is sometimes found in tidepools (Fig. 2.12 C). During low tide, a tidepool that is not connected to the ocean can become hypersaline when evaporating water leaves salts behind.
Using a Hydrometer to Determine Density and Salinity
Both temperature and salinity affect density. The more dissolved salts there are in a body of water, the greater the density of the water. If the density and temperature of a water sample are known, salinity can be determined from a graph (Fig. 2.13).
Fig. 2.13. Lines define relationships between temperature (red vertical lines), density (grey horizontal lines), and salinity (blue curved lines).
Image by Byron Inouye
Fig. 2.14. A hydrometer used to determine water densities in g/mL. The pink shaded region indicates the optimum density of saltwater aquaria at an average temperature of 20ЛҡC to 25ЛҡC.
Image by Byron Inouye
In a sample of water with a known temperature, density can be measured with a hydrometer. A hydrometer can be used to determine the density of a liquid by measuring the level at which the hydrometer floats in it. The more dense the liquid, the greater the buoyant force it exerts, and the higher the hydrometer will float in the liquid. The line on the hydrometer that is level with the surface of the liquid corresponds to its density. Recall that density is a measure of how much mass (e.g., grams) there is in a given volume (e.g., milliliters). Fig. 2.14 shows a hydrometer that can be used for determining the salinity of solutions that have densities from 1.000 grams per milliliter (g/mL) to 1.060 g/mL.


