Title
Activity: Beach Profile Mapping
NGSS Science and Engineering Practices
NGSS Crosscutting Concepts
NGSS Disciplinary Core Ideas
Materials
• Table 5.3
• Table 5.4
• Figure 5.12
• Three one-meter sticks or two transit poles
• Tape
• Maker
• Transect line or long rope marked at regular intervals
• GPS (optional)
• One flag or stake per transect (optional)
• Level (optional)
Image caption
Fig. 5.12. Profiles of typical coastal features, see Table 5.3 to identify the features marked with letters
Image copyright and source
Procedure
Safety Note: Take safety precautions around the water; follow posted signs and lifeguard directions. Bring water, sunscreen, a hat, and other things that will keep you hydrated and safe. Be aware of the tide and whether the water is rising or falling. Always have at least one person in your group watching the water and waves, especially when you are working close to the water’s edge.
- (Optional) Look at pictures of your study site before your field trip.
- Discuss coastal features and potential beach hazards.
- Determine locations to lay your profile transects (Step 3). (Your plan may change when you arrive at your location based on factors like water conditions.)
- Practice making a beach profile (Step 5) at school on a slope or stairs.
Fig. 5.13. Attach two one-meter sticks together to make one two-meter high transit pole.
- If using meter sticks, attach two one-meter sticks together to make one two-meter high transit pole (Fig. 5.13).
- Hold the first meter stick perpendicular to the ground with the zero centimeter mark toward the sky. These values are positive; label this meter stick “positive”.
- Hold the second meter stick in line above the first meter stick so that the centimeter marks are facing the same side and the zero centimeter mark is toward the ground. These values are negative; label this meter stick “negative”.
- The point where the meter sticks join is the zero mark. This is the point you will align to the horizon.
- Attach the meter sticks together with tape.
- Select locations for your profile transects.
- Observe the beach. Consider the following questions.
- Are the features regular or irregular across the beach? For example, where does the vegetation start? Are there sand dunes or berms?
- Can you observe high or low tide water levels?
- Where are the boundaries between coast, beach, and water (the shoreline and coastline)?
- Transects will be run perpendicular to the water’s edge.
- Work with your classmates to decide where to place your transects. You may choose to place them at regular intervals across the beach, or arrange the transects to map specific features of the beach in more detail.
- Decide how far from the shoreline you will lay your transects. Consider the following limitations:
- How long are your transects?
- How large is the beach?
- Is the tide advancing or retreating? What are other wave and water safety conditions that need to be taken into account?
- Use flags or other objects to decide where you will lay your transects; these can be easily moved around the beach while you finalize your transect locations.
- Lay your transects perpendicular to the shoreline.
- ​Your transect should run from the shoreline (mean low tide level) to a pre- determined location, such as a certain number of meters onshore or to the vegetation line. However, you may have to start your transect at a higher water line depending on the tide and water conditions.
- The zero centimeter mark of the transect line should be at the edge of the water.
- Record the distance between each transect line and between each transect line and a reference point, such as a tree or trashcan, so that you can easily find the location of your transect line again.
- (Optional) Take GPS points to mark the location of each transect line.
- Draw your study location, including the location and distance of each transect line, the features at the beginning and end of the transect lines, the water conditions, and other coastal features.
Fig. 5.14. Beach profiling by sighting the vertical distance between two known points
Image by Linda Venenciano
- ​Measure the beach profile at regular intervals using a two person method. These directions are written starting at the costal edge of the transect and assume a transect length of 20 m and interval of 1 m. You may use smaller intervals if your beach is narrow. Your transect length may be longer or shorter than 20 m. If the tide is rising, start at the edge of the transect next to the water.
- Person A stands at the end of the transect (20 m from the waters’ edge) and holds the single meter stick or a transit pole vertically. You can use a level to make sure the pole is vertical.
- Person B puts the second transit pole one meter away (at 19 m) on the transect. If you do not have a commercial transit pole, this person would hold the taped-together meter sticks as a transit pole, with the “positive” side towards the sand. The measurements on this transit pole should face Person A’s transit pole.
- Use the horizon, where the water meets the sky, to determine the vertical distance the beach slopes between the two transit poles.
- Person A will look along the top edge or through the sighting hole of the transit pole or meter stick to the horizon.
- This point is the zero point.
- If you are using a meter stick, and your stick has a hole on one end, you can use it as your sighting hole for this activity.
- Person B will move their finger on their transit pole until his or her finger aligns with the horizon and the top of Person A’s meter stick (Fig. 5.14).
- If Person B’s finger moves down on the transit pole, the value read is positive (e.g., +5 cm). You will get positive readings if Person B is higher than Person A.
iv. If Person B’s finger moves up, the value read is negative (e.g., –5 cm). You will get negative readings if Person B is lower than Person A (as seen in Fig. 5.14, because the beach is sloped down).
- Record value on the beach profile data sheet (see example, Table 5.4).
- Continue to collect data every meter along your transect, always keeping the meter sticks one meter apart. For example, for the next measurement person A, holding the single meter stick, would stand at 19 m and person B, holding the transit pole, would stand at 18 m.
- Take any other measurements or make other observations that may be related to beach shape at this location.
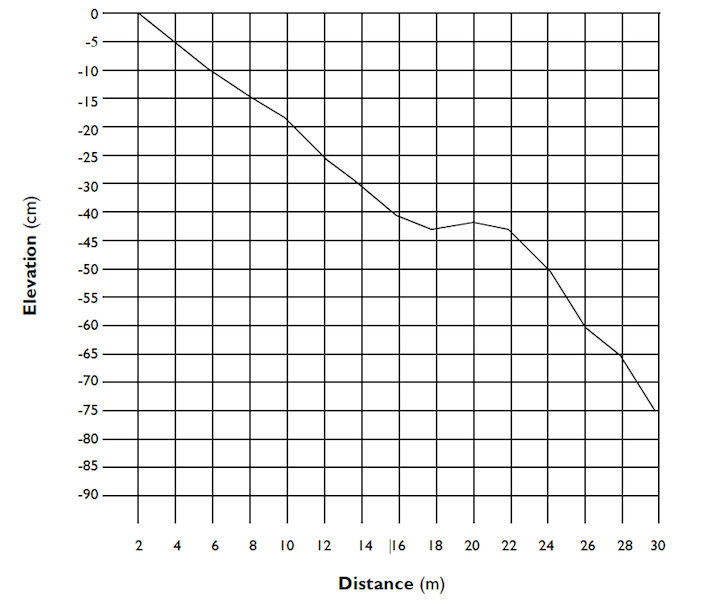
Fig. 5.15. Sample beach profile of one transect line.
- Graph your beach profiles on graph paper, with height on the y-axis and distance on the x-axis. An example of a beach profile is given in Fig. 5.15. Multiple transect lines can be plotted on the same graph, on a three-dimensional computer plot, or on separate graphs taped together to show the slope of the beach profile.
Activity Questions
- Why is it important to run transects perpendicular to the shoreline?
- In your own words, describe the elevation change at your site.
- Was the elevation change uniform from one end of the beach to the other? Explain why you think this is.
- How do the beach profiles you created compare to your observation of the beach? Label beach features on your beach profile, referring to Table 5.3.
- Which coastal features that are defined with respect to changes in the level of the tide did you observe (refer to Table 5.3 and Fig. 5.12)?
- Were there any beach features that you missed when you conducted your beach profile? If so, why?


")


")


