Title
Activity: Comparison of Water with Other Liquids
Materials
For Parts A-D:
- Tap water
- Oil
- Isopropyl alcohol
- Food coloring
- 3 Eyedroppers or plastic pipettes
Additional Materials for Part A:
- 1 Glass microscope slide
- Wax paper (approximately 4cm x 6cm)
- Paper towel
Additional Materials for Part B:
- 3 pennies
- Paper clip
- Binder clip
- Barbeque skewer or toothpick
Additional Materials for Parts C and D:
- 3 small (approximately 1cm – 2cm diameter) glass vials
- Tray or other material to contain spills
- Sponge or other material to clean up spills
Procedure
*Note* Before you begin, Use the food coloring to dye your water sample and your alcohol sample in order to make the following observations easier (dye them different colors). Be careful to dye them very slightly (use as little dye as possible).
- Compare the shape of drops of liquids (water, alcohol, oil) on various surfaces.
- Use your eye dropper or plastic pipette to place one drop of equal volume of each of the three liquids onto each of the following surfaces:
- Glass microscope slide
- Wax paper
- Paper towel
- Observe and record the appearance of each drop, paying attention to shape and size. Draw each drop next to your notes and label with the appropriate surface.
- Use the barbeque skewer or toothpick to try to break each of the single drops into multiple drops. (e.g. by dragging the skewer through the drop or by getting skewer wet and dropping elsewhere – or both). Next to your drawings, record your results about the relative ease of breaking apart the drops and the behavior of each drop in response to being poked.
- Invent and record a hypothesis for the behavior of water, alcohol and oil that you observed. Use the language of cohesion, adhesion, polar and nonpolar in relation to each of the liquids. Describe any differences you observed in relation to the surface the liquids were touching.
- Recall the penny experiment from Activity 2 where you were able to observe the effects of adhesion and cohesion on water’s ability to pile on top of the penny. Revisit this concept, but this time compare the three test liquids (water, alcohol, and oil).
- Use your observations from Activity 2, the behavior of test liquids in part A and your prior knowledge of water, alcohol and oil to predict which liquid will be able to pile the highest on a penny.
- Use the eyedropper or plastic pipette to drop each test liquid on the surface of a penny (you should have three pennies and three eyedroppers to avoid contamination). Drop carefully and slowly to fit as many drops as possible on each penny. Count each drop until the liquid spills over the side of the penny.
- Record your results for each liquid.
- Re-pile your pennies with liquid until they are almost ready to spill over. Carefully observe and draw each penny and liquid.
- Test the cohesiveness of each liquid by poking the piles with a skewer or toothpick into the surface of the liquid piled on the penny.
- Record your observations and draw what you see for each liquid. Pay special attention to water surface where the skewer is entering the pile of water.
- Repeat these procedures using a paper clip and/or a binder clip. Try to indent the piles of liquid as much as possible without spilling it.
- Which liquid appears the most cohesive? The least cohesive? Invent and record a hypothesis for the behavior that you observed using the language of cohesion and adhesion in relation to the skewer, the paperclip (and/or binder clip) and the three liquids.
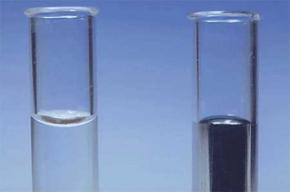
- Observe the three test liquids (water, alcohol, and oil) in glass vials.
- Use your eyedropper or plastic pipette to fill your large glass vial Вѕ full of water. Repeat with the other glass vials for both alcohol and oil.
- Observe and draw each of the samples in their vials.
- Compare the meniscus between the small and large vial for each liquid sample. Record your observations next to your drawings.
- Compare the difference between the liquid samples. Record your observations next to your drawings.
- Challenge yourself! Use your observations, and the results of part B, to predict which liquid will be able to overfill the glass vial the most.
- Record your prediction
- Test your prediction using the eyedropper or plastic pipette to overfill the vials with each of the liquids. Keep dropping liquid until no more will stay on your vials without spilling over.
- Observe, draw, and compare the results of water, alcohol, and oil the vials. Indicate which liquid is at the highest a height above the edge of the vial.
- Keep your vials full for part D.
- Compare your observations to your prediction. Record any differences in what you observed from what you predicted and explain your observations.
- Which liquid will sink? Use your liquids and vials from step B to investigate and compare the properties of your three test liquids.
- Predict what will happen when you drop one liquid into another.
- Complete Table 3-2 with your predictions.
- Test each combination.
- Record your observations in the table.
- Invent and record a hypothesis for the behavior of water, alcohol and oil that you observed. Use the language of density and provide your best explanation for any mixing or non-mixing that you observed.
Table 3-2: Investigation into which liquids will sink.
| Liquid combination |
Predictions |
Result |
| Water drops in alcohol |
|
|
| Water drops in oil |
|
|
| Alcohol drops in water |
|
|
| Alcohol drops in oil |
|
|
| Oil drops in alcohol |
|
|
| Oil drops in water |
|
|
Activity Questions
- Describe your overall conclusions about the relative cohesive and adhesiveness water, oil and alcohol.
- Describe the difference in ability of water, oil and alcohol to adhere (or stick) to the glass, the wax paper and the paper towel surface. Knowing that similar types of material stick well to each other (i.e. polar sticks to polar), use your your knowledge of each test liquid and its relative polarity to estimate the polarity of each surface: glass, wax paper and paper towel?
- Remember the capillary action you observed in Activity two. Based on your knowledge of each test liquid and its adhesiveness to glass in this activity, rank the liquids (water, alcohol, and oil) in order of which you would expect to climb highest in a capillary tube.
- Scientists use the term miscible to describe liquids that mix together and immiscible to describe liquids that do not mix. List the liquids from this activity that were miscible and then those that were immiscible. What generalizations can you make based on your lists?
- Explain this mystery: You purchased a bottle of olive oil at the store. When you got the oil home, you noticed a green drop of liquid at the bottom of the bottle. You have heard that some olive oil companies use food dye to help color the olive oil a prettier color:
- What are clues that support the identity of this green drop as food dye?
- Why is it at the bottom of the container?
- Why didn’t the food coloring mix with the oil?
- Do you think the green drop should prevent you from using the oil?
- The meniscus of the liquids you observed were concave, meaning that they were shaped like a lower-case u. Some liquids, like the element mercury (Hg), form a convex meniscus, meaning that it is shaped like a lower-case n (see Fig. 3-18). Invent and record a hypothesis to explain why liquids like water have a concave meniscus in a glass vial whereas mercury has a convex meniscus in a glass vial. Use the language of adhesion and cohesion.
")


")


