Title
Activity: Tide Formation—Gravitational Pull
NGSS Science and Engineering Practices
NGSS Crosscutting Concepts
NGSS Disciplinary Core Ideas
Materials
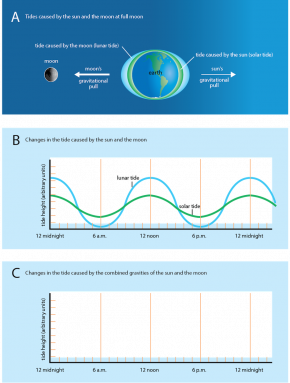
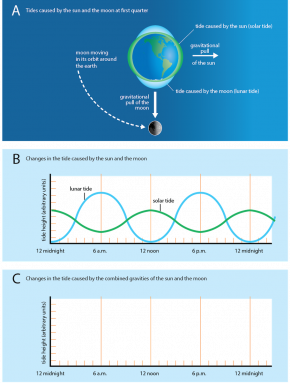
In Fig. 6.8 A and Fig. 6.9 A, the two hypothetical tidal bulges caused by the sun and the moon are shown as if they occur independently of each other. Recall that when two waves, including tidal bulge waves, meet, they combine.
Fig. 6.8. Changes in tide levels when the sun, the moon, and the earth are in line. (A) Tides caused by the sun and the moon during full moon (B) Changes in the tide caused by the sun and the moon (C) Changes in the tide caused by the combined gravitational pulls of the sun and the moon.
Fig. 6.9. Changes in tide levels when the sun, the moon, and the Earth form a right angle
Procedure
- Construct a tide graph showing the combined effect of the sun and the moon when they are in line with the earth (Fig. 6.8 A).
- From Fig. 6.8 B, determine the tide height at midnight on the Y-axis caused by the moon.
- From Fig. 6.8 B, determine the tide height at midnight on the Y-axis caused by the sun.
- Add the two tide heights, caused by both the sun and moon, together.
- Plot the combined tide height in Fig. 6.8 C.
- Repeat steps a–d for points every 2 hours in Fig. 6.8 (2 a.m., 4 a.m., 6 a.m., etc.).
- Connect the data points to produce the smooth, curving tide graph for this day.
- Construct a tide graph showing the combined effects of the sun and the moon when the sun, the moon, and the Earth form a right angle (Fig. 6.9 A). Repeat the steps in Procedure 1, but use the information given in the graphs Fig. 6.9 B and plot the combined tide height in Fig. 6.9 C.
Activity Questions
- Which of your graphs shows spring tides? Which shows neap tides?
- The drawing in Fig. 6.8 A shows the tide at full moon.
- Where would the moon be located during a new moon?
- Draw what the tide would look like during a new moon (use the same data as in Fig. 6.8 B).
- Compare your drawing to Fig. 6.8 C. Explain why the tide graphs are similar or different.
- The drawing in Fig. 6.9 A shows the tide at the third quarter of the moon.
- Where would a first quarter moon be located?
- Draw what the tide would look like during a first quarter moon (use the same data as in Fig. 6.9 B).
- Compare your drawing to Fig. 6.9 C. Explain why the tide graphs are similar or different.
- Approximately how many days does the moon take to move from its position shown in Fig. 6.8 A to its position shown in Fig. 6.9 A? Explain your reasoning.
- Assume that the tide graph you drew in Fig. 6.8 C occurred on March 1. On what dates would we observe the tides plotted in
- Fig. 6.9?
- Question 1 (during the next spring tides and neap tides)?
- Question 2 (during the following new moon)?
- Look at the combined tide graphs you drew in Fig. 6.8 C and Fig. 6.9 C. At what time are the low tides?
- Explain why in Fig. 6.8 C the high tides caused by the sun and the moon both occur at midnight, but that in Fig. 6.9 C the high tide caused by the moon occurs at 6 a.m.


