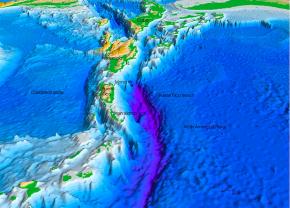
Fig. 7.28. In this computer model of the ocean floor north of Puerto Rico, Caribbean Sea, western central Atlantic ocean basin, the purple areas indicate the Puerto Rico Trench, 8.6 km below the ocean surface. It is the deepest point in the Atlantic ocean basin.
Scientists know more about the surface of the moon than about the bottom of the ocean. The broad size of the ocean floor, its depth and its combination of extreme conditions (cold, dark, with intense water pressure) all contribute to making its exploration difficult. Early civilizations believed the ocean floor to be a smooth bowl, devoid of features or life. However, the ocean floor is not flat; it has a wide variety of geological features (e.g., Fig. 7.28; Table 7.6).
Navigators of ships and submarines are interested in avoiding dangers or impediments to their progress. Marine archeologists and professional treasure hunters are interested in finding areas likely to have shipwrecks. Geologists and oceanographers are interested in what the seafloor can tell them about the recent and ancient history of the planet, the formation of islands and ridges, and the movement of geologic plates. Biologists, conservationists, economists, and fishermen are interested in features that support large populations of marine life. Oceanographers, geographers, mariners, and cartographers have a whole vocabulary for these features. Table 7.6 lists many of the common features of the seafloor and coastline.
Table 7.6. Common features of the seafloor and coastline
| Abyssal plain. A flat region of deep ocean basins. |
| Alluvial fan. A broad, sloping deposit of sediments at the mouth of a river or at the foot of a submarine canyon or a river canyon. |
| Atoll. A ring-shaped coral reef surrounding a lagoon. It may have low sand islands. Atolls rest on submerged volcanic islands. |
| Bank. A navigable shallow area of the ocean caused either by elevation of the seafloor or by submergence of a landmass. |
| Bay. An inlet of the sea; an indentation in the shoreline, often between headlands or capes. |
| Cape. A large point or extension of land jutting into a body of water. A cape may be a peninsula or a hook of land. |
| Channel. A deeper part of a river or harbor that is navigable. The word is sometimes used to name a broad strait. |
| Cliff. A very steep or overhanging land feature. |
| Coast. A strip of land bordering the sea. |
| Continental shelf. The land forming the shallow seafloor extending outward from the edge of a continent; submerged part of a continent extending outward 15 km to 50 km to the continental slope. |
| Continental slope. The sloping front of a continental shelf; the place where the continent ends. These are long slopes, often 20 km to 40 km wide or more. The bottom of the continental slope is the continental rise. |
| Continental rise. The area of the continental shelf between the continental slope and the deep seafloor where sediments from the continent accumulate. |
| Delta. An alluvial deposit at the mouth of a river. |
| Estuary. A river mouth or channel, or the drowned seaward end of a valley where fresh water from land mixes with seawater. River flow in some estuaries continues across the continental shelf, carving out a submarine canyon. |
| Guyot. A seamount with a flat top. Guyot tops are always below the ocean surface. Also called a tablemount. |
| Headland. A cape or other landform jutting into the ocean. It is usually high above water and prominent when viewed from the sea. |
| Island. A landmass smaller than a continent and surrounded by water. |
| Island chain. A group of islands formed by the same geological process (also called an archipelago). |
| Isthmus. A narrow strip of land connecting two larger landmasses. |
| Lagoon. A shallow body of quiet water almost completely cut off from the open ocean by coral reefs, barrier islands, or barrier beaches. |
| Ocean basin. A large depression in the earth's crust that holds the water of an ocean. |
| Ocean ridge. A long, continuous mountain range on the seafloor. Ocean ridges are often of volcanic origin at a point or line of separation in the earth's crust. |
| Ocean trench. A deep cut or trench in the seafloor, usually close to where continental shelves and seafloors meet. |
| Peninsula. A piece of land almost completely surrounded by water. It is usually connected to a larger land body by a narrow land strip called a neck or an isthmus. |
| Point. The narrow tip-end of a cape, headland, peninsula, or other land feature jutting into a body of water. |
| Reef. A shallow rock or coral formation often exposed at low tide. A fringing reef forms along the shore; a barrier reef is an offshore coral ridge. |
| Seamount. An isolated undersea hill or mountain. It is usually in the form of a cone. |
| Shoal. An area of the ocean, such as a sandbar, that is too shallow to navigate. |
| Sound. A wide waterway connecting two larger bodies of water. It may be a body of water between the mainland and an offshore island. |
Strait. A long, narrow water passage connecting two larger bodies of water.
Submarine canyon. A deep canyon cut into the continental shelf and slope, often at the mouth of a large river. |
Contour Maps
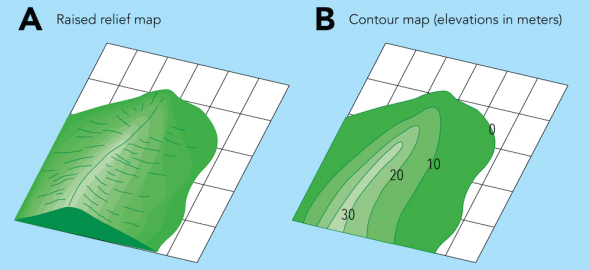
Scientists use detailed, accurate maps and models of geological features to help explain how the features of the earth form and how they change over time. Three-dimensional raised-relief maps provide a scale model of landforms and oceanic features (Fig. 7.29 A). Raised-relief maps or terrain models are sculpted maps that can be made to show the effects of tectonic activity or erosion, thus making the landforms look more realistic. Contour maps are two-dimensional maps that use colors and shades to convey information such as the relative depths and elevations of different geological features (Fig. 7.29 B). A contour map shows the depth (below sea level) or the elevation (above sea level) with a series of contour lines that follow a single representative depth or elevation. For example, sea level is recorded as вҖң0вҖқ and represents the average low water level. Geographic features above sea level are recorded with positive numbers (such as 10 and 20, representing, for example, meters above sea level). Contour lines connect points on the map with the same elevation to help show changes in elevation. Contour maps for land are called topographic maps. Contour maps for ocean depths are called bathymetric maps or charts.
Image caption
Fig. 7.29. Examples of different types of maps showing the same geological feature (A) Three-dimensional raised-relief map (B) Two-dimensional contour map
Image copyright and source
Activity
Use two-dimensional maps to learn about the major landform and seafloor features of the earth.
Activity
Construct contour and raised relief maps of common underwater features.
Mapping the Seafloor
Centuries ago sailors ventured into unknown oceans to discover new lands. They had no accurate charts or maps to guide them to new places or back home. After enduring months of hardships at sea, land meant safety from the dangers of the sea, relief from hard work aboard the ship, and fresh food and drinking water. However, land also meant new dangers to sailors because a ship could run aground in unfamiliar shallow waters. Ship captains had to be cautious. They sent sharp-eyed sailors to look for dangerous shoals, reefs, and rocky outcroppings. Sailors knew that visual sightings could not always detect hazardous underwater features, particularly if the water was choppy or murky. Anxious to avoid running aground, sailors measured the ocean depths using a process called sounding.
Depth Soundings
Fig. 7.40. Sounding with a weighted handline
Depth sounding is the process of measuring the depth of a given point in a body of water. The earliest soundings were made by lowering rope into the water with a weight tied to one end (Fig. 7.40). The rope was allowed to run freely until the weight struck the ocean floor. The length of the rope let out was an approximate measurement of the water depth. Sticky tallow or grease was often smeared on the weight to pick up sand and other sediments from the seafloor. Data on ocean floor depths and sediment qualities could then be added to ocean maps.
Simple handline soundings can be still used today, but they are only reliable in calm, shallow areas near continental shelves, in inland seas, and near mid-ocean islands.
Traditional handline sounding methods required slowing or stopping the vessel. Making deepwater soundings took a lot of time, so they were only done about every hundred kilometers. Nevertheless, enough sounding data were accumulated to create maps that gave a rough idea of the shape of the seafloor. Given enough sounding data, also known as using bathymetric data (bathy means "deep" or "depth"; metric refers to measuring), contour maps and nautical charts can be constructed.
Activity
Use bathymetric sounding data from nautical charts to map seafloor features.
Sonar Soundings and Seafloor Profiles
Modern oceanographers use sophisticated techniques to gather data about the sea floor. The data are then plotted on nautical charts and maps and used to create models that help us understand what seafloor features are like. A major advance in the ability to measure ocean depths was made in the 1930s when echo-sounding sonar devices (also called fathometers) replaced sounding lines.
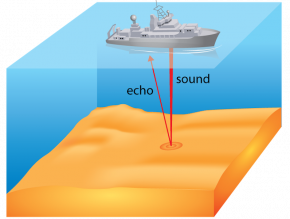
Fig. 7.45. Echo-sounding sonar can be made while a ship is underway.
Sonar is a technique that uses sound to measure distances between underwater objects. The word sonar is formed from the term sound navigational ranging. Sonar works by sending out pulses of sound waves from a ship (Fig. 7.45). Instruments record the time it takes for the sound waves to travel to the bottom, reflect, and return to the ship. Because the speed of sound in seawater is known to be about 1,460 meters per second, the depth can be calculated based on the time it takes for the sound wave to leave the instrument, reflect off the bottom, and return to the instrument. The speed of sound in seawater varies with the temperature and salinity in different regions of the ocean, and these variations must be taken into account when depth determinations are being made. Sonar devices are so inexpensive and easy to operate that they are commonly used even on small outboard motorboats.
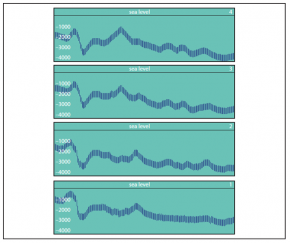
Fig. 7.46. Echograms are two-dimensional images of seafloor features along a transect line. The profile series shown here illustrates data obtained from parallel transects made several kilometers apart.
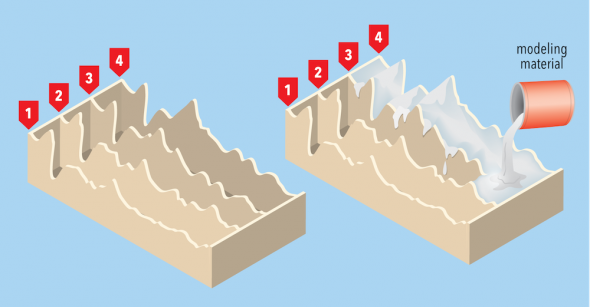
The great advantage of using sonar is that a vessel can keep moving at speed while soundings are made. Recording a series of soundings on a strip of paper or making a computer printout produces a two-dimensional visual profile of the seafloor, called an echogram or sonograph (Fig. 7.46). To map the seafloor, research vessels cross the ocean making sonar profiles along carefully navigated, parallel courses called transect lines. After many profiles are made, they can be assembled to create complex maps or three-dimensional models of the seafloor by filling the spaces between the profiles using computer models, or modeling material (Fig. 7.47).
Image caption
Fig. 7.47. A three-dimensional model of the ocean floor constructed by assembling a series of parallel profiles.
Image copyright and source
Activity
Simulate the collection and use of sonar data to make hypotheses about the ocean floor.
Swath Mapping
Fig. 7.52. Swath mapping enables scientists to collect data over a large area of the seafloor.
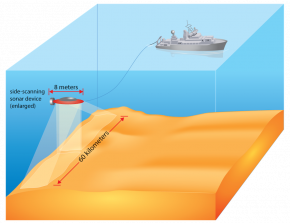
Maps and models produced from single-beam sonar profiles lack the precision and detail needed for modern oceanography. Most single-beam profiles are made from lines spaced from 1 to 10 km apart. Without more data, mapmakers can only guess what features lie between the sample lines. In the 1970s, a whole new seafloor-mapping technology was developed called swath mapping. Instead of sampling depth along a line like a single-beam sonar sounding, swath mapping takes many measures of depth within a two-dimensional area of the seafloor (Fig. 7.52).
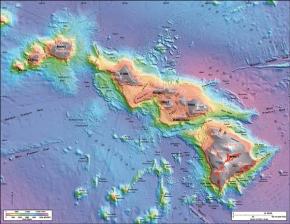
Fig. 7.53. This is a sea floor map made of the Southernmost Hawaiian Island chain by University of HawaiвҖҳi researchers using sonar. It depicts the underwater volcanoes and other features of the sea floor.
Image courtesy of United States Geological Survey (USGS)
On a single transect, swath mapping can sound an area 10 to 60 km wide and as long as the distance traveled by the ship. Details in swath maps are so clear that small-scale features such as faults, craters, landslides, and the paths of sediments flowing through submarine canyons can be clearly identified. Features as small as 1 cm across can be detected using swath mapping. One swath-mapping device, called multibeam sonar, sends out and tracks up to 16 closely spaced sonar beams at a time (see example Fig. 7.53). Computers translate the multiple echoes, assemble data from parallel transects, and then draw a detailed bathymetric contour map of that section of the seafloor. Another swath-mapping device, called side-scanning sonar, uses computers to translate the multiple echoes into detailed three-dimensional images of seafloor features. The images look like photographs taken from an airplane. The difference is that sound waves, not light waves, are used to produce the images.
Light Detection And Ranging Systems (LiDAR)
LiDAR uses lasers (light waves) and Global Positioning Systems (GPS) to determine the position of topographic features. LiDAR can be used to obtain very accurate measurements of the sea floor, often within a few centimeters. LiDAR is very powerful for research because people can use LiDAR from moving planes. However, because lasers use light waves, LiDAR can not penetrate as deep as sound waves in water. Typically, LiDAR can be used to measure the depth of water and to map the sea floor to a depth of about 50 m. However, the exact depth depends on water turbidity; the less turbid (more clear) the water, the deeper LiDAR can penetrate.
Satellite Oceanography
Satellites are essential to mapping and measuring the oceans (Fig. 7.54). Satellites equipped with communication devices and power sources make global communication possible by telephone and television. Satellites can link ships and airplanes to land stations and to each other. Navigation is more advanced because satellite communication systems help to determine exact latitude and longitude. Computers record seafloor measurements and locations and plot the data onto maps.
Some satellites are equipped with cameras that continuously take photographs of the earthвҖҷs surface and relay them to receiving stations. The satellite weather maps in newspapers are a familiar example. For oceanographers and others who work or travel on the ocean, satellites provide up-to-date information about storms and other weather conditions at sea.
Fig. 7.54. Satellites collect data directly from the ocean and link oceanographic ships with data-collecting buoys.
SEASAT, the first satellite dedicated to oceanography, was launched in 1978. It allowed researchers to detect and map seafloor features around areas rarely visited by ships, like Antarctica. SEASAT mapped seafloor features indirectly by measuring sea height. Its radar sent out pulses of radio waves that reflected off the ocean surface, giving precise measurements of the distances between the satellite and the ocean at different points (Fig. 7.54). These measurements showed that the surface of the ocean is uneven. Depressions in the surface suggest the presence of massive seafloor features, such as mid-ocean ridges and seamounts that increase gravitational pull. Bulges in the surface are evidence of deep seafloor trenches and fracture zones, which decrease the gravitational pull.
Although satellites cannot yet give us precise information about small areas of the seafloor, they provide oceanographers with information about global phenomena such as cloud and ice formation, wind patterns, and surface temperatures. Interpreting all the data collected by modern oceanographic research ships and satellites occupies many researchers and many complex computer systems full-time.
