Materials
- Elodea sp. (or Egeria sp. often sold under the common name “anacharis”) in a container of fresh water
- Six 50 mL Erlenmeyer flasks
- Six one-hole #2 rubber stoppers
- Six 1 mL graduated glass serological pipettes
- Red and green light filters
- Aluminum foil
- Scissors
- Tape
- Skewer
- Thermometer
- Balance
- Towels
- Table 2.8
- Fig. 2.40 and 2.41
- Blue light filter (optional)
- Petroleum jelly (optional)
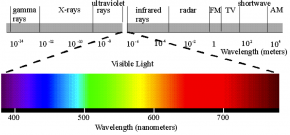
Fig. 2.40. This diagram of the electromagnetic spectrum emphasizes the small portion of the spectrum that is visible to human eyes. Wavelengths are measured in meters (m) along the grey bar and in nanometers (nm) along the colored bar showing visible light.
Image courtesy of Philip Ronan, Wikimedia Commons
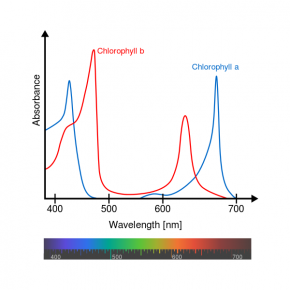
Fig. 2.41. Relative absorbance of the visible wavelengths in sunlight by the pigments chlorophyll a and chlorophyll b
Image courtesy of Daniele Pugliesi and M0tty, Wikimedia Commons
Baking Soda Solution
Baking soda serves as a source of carbon dioxide. The Elodea will be placed in this solution to speed up the photosynthesis reaction.
- Baking soda (sodium bicarbonate, NaHCO3)
- Balance
- Container
- Spoon
- Fresh water
- 1 L beaker
Procedure
- Elodea is a genus of freshwater aquatic plants sold in pet stores for aquariums. Observe and describe the Elodea specimen.
- Use Fig. 2.40 to determine the range of wavelengths that corresponds to white light and to each color: red, blue, and green. Fill in the first column of Table 2.8.
- Use the absorption spectrum for chlorophyll a and chlorophyll b (Fig. 2.41) to answer the following questions:
- What color(s) does chlorophyll a absorb most? Least?
- What color(s) does chlorophyll b absorb most? Least?
- In this experiment you will be investigating the effect of light color (wavelength) on the rate of photosynthesis by measuring gas production in Elodea. Elodea has both chlorophyll a and chlorophyll b.
- Using what you know about the electromagnetic spectrum and chlorophyll, predict the flask that will have the plant with the highest gas production and write “1” in the “Prediction” column of Table 2.8. The more light energy the plant absorbs, the more gas it should produce.
- Write number “2” in the “Prediction” column of Table 2.8 for the flask that you predict will have the second highest gas production.
- Continue numbering in the “Prediction” column of Table 2.8 through “6,” with 6 being the flask that you predict will have the least gas production.
- Using your predictions, develop a hypothesis about how you expect light color to affect photosynthesis in Elodea. For example,
Photosynthesis should be fastest with ____________ wavelength(s) of light and slowest with ____________ wavelength(s) of light because ________________.
- Prepare a baking soda solution.
- Weigh 25 g of baking soda.
- Add baking soda to 1 L of fresh water.
- Stir until the baking soda is completely dissolved.
- Cut light filters and place light filters and foil around flasks (or use flasks prepared by your teacher).
- Cut out rectangles of green and red filter paper slightly bigger than the flasks.
- Wrap filters around the flasks, secure with tape. Trim excess filter.
- Wrap one flask with foil.
- Remove a few branches of Elodea from the holding container. Visually inspect the Elodea, and remove any part of the plant that looks unhealthy or has different leaf morphology (shape) than the rest of the plant. Blot Elodea dry with towels.
- Place Elodea into five of the six flasks (one clear flask will not contain Elodea):
- Using a balance, weigh 2.5 g of Elodea. The Elodea should be as close as possible to 2.5 g, within 0.1 g (i.e., between 2.4 and 2.6 g). Write the weight in Table 2.8.
- Insert Elodea into the flask. If necessary, you can break the Elodea into smaller pieces and use a skewer to distribute the Elodea evenly in the flask.
- Assemble the flask-stopper-pipette apparatus.
- Working over towels, slowly fill each flask all the way to the top with baking soda (sodium bicarbonate) solution.
- Firmly press a stopper into each flask. Sodium bicarbonate solution will spill out of the flask as you insert the stopper. Applying petroleum jelly to the outer surfaces of the rubber stoppers may help to form an airtight seal.
- Insert the pipette into the stopper hole by holding the pipette with a dry towel. Gently twist the tapered tip of the pipette into the stopper until water rises in the pipette and the pipette is firmly in place. The water level should reach between the 0.8 and 0.7 mL lines. DO NOT FORCE the pipette into the stopper as the pipette can break. If you are having difficulty getting the pipette into the stopper, ask your teacher for assistance.
- Dry the outside of each flask with a towel.
- Set the flasks in the sun. Make sure each flask is exposed to a similar amount of sunlight.
- Record the starting volume of the liquid in each pipette and the time in Table 2.8. Read the bottom of the meniscus of the water in the pipette. Note that the numbers on the pipette are smallest at the top and largest at the bottom.
- Your teacher will let you know how long to run the experiment. While the experiment is running,
- record the weather conditions, especially noting the amount of sunlight, and
- observe what is happening in the pipettes and the flasks without disturbing the light filters or foil.
- At the end of the experiment, record the ending volume (water level) in each pipette and the time in Table 2.8.
- Subtract the start volume from the final volume to get the total amount of gas produced in each flask. Record the amount in Table 2.8.
- Rank the gas production in each flask, by writing “1” in the “Observation” column for the flask with the plant the produced the most gas and numbering through “6” for the flask that produced the least gas.
- OPTIONAL: repeat procedure steps 7 to 16 using a blue light filter.
- Clean up the experiment.
- Holding the pipette with a dry towel, gently twist the pipette while pulling up to remove it from the stopper. Stand the pipette upright in a container and let it drip dry.
- Remove the stopper from the flask.
- Dispose of the plants and sodium bicarbonate solution as directed by your teacher. Clean each flask.
- Wipe the light filters with fresh water to remove traces of sodium bicarbonate solution.
- Compare your results to those of other groups using a class data chart.
- What caused the water in the pipettes to rise?
- What gas is being produced in the flasks by Elodea? What process is producing this gas?
- Compare your predictions and observations. Was your hypothesis supported? Why or why not? Give you answer in terms of absorption of wavelengths by chlorophyll pigments.
- How did your results compare to those of the rest of the class? Hypothesize possible reasons for any unexpected results.
- Elodea should not photosynthesize in the dark (e.g., in the flask covered with foil). However, Elodea in the dark may still produce gas.
- What gas is likely being produced?
- What process is likely producing this gas?
- What was the purpose of the clear flask with no plant? In other words, is the production of gas the only thing that may affect the starting and ending water volume in the flasks?
- How can you use the results of your control flasks to more accurately calculate gas production in the other flasks?
- How can this experiment be improved to more accurately measure the photosynthesis rate in Elodea? What sources of error can be further controlled?
- Why are plants green? Answer in terms of the wavelengths of light they absorb. (Hint: What colors do chlorophyll a and chlorophyll b absorb and reflect?)
- Based on Fig. 2.40, if green glass is a green-yellow color, what range of wavelengths might it be reflecting?
- Based on Fig. 2.40 and Fig. 2.41, what color(s) would the pigments chlorophyll a and chlorophyll b appear to the human eye?


