Printer Friendly
Title
Activity: Water Layers
NGSS Science and Engineering Practices
NGSS Crosscutting Concepts
NGSS Disciplinary Core Ideas
Materials
- Figs 2.10 and 2.11
- Pencil
┬Ā
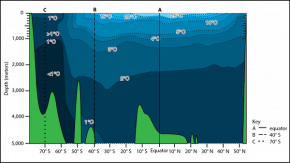
Fig. 2.10. Idealized vertical temperature profile of the Pacific ocean basin showing water in blue and seafloor features in green. The highest, or warmest, water temperatures are shown in light blue. The lowest, or coldest, water temperatures are shown in dark blue.
Fig. 2.11. Graph of the temperature of the Pacific ocean basin at (A) the equator, (B) 40˚ S latitude, and (C) 70˚ S latitude
Procedure
- Graph the vertical temperature profile of the Pacific ocean basin at the equator, 0˚ latitude.
- Locate Line A in Fig. 2.10. Line A is a vertical line drawn at the equator, 0˚ latitude, from the surface of the Pacific ocean basin to the seafloor.
- Starting at the surface, determine the temperatures along Line A for each 250 meters (m) of depth. Plot the temperatures on the grid in Fig. 2.11, then connect the points with a solid line.
- Examine the graph and label the thermocline.
┬Ā
- Make a second graph in Fig. 2.11. This time show the vertical temperature profile at 40˚ S latitude.
- Obtain the temperature data from Line B in Fig. 2.10. Determine the temperatures for each 250 m of depth.
- Connect these data points with a dashed line. Label the thermocline.
┬Ā
- Make a third graph in Fig. 2.11. This time show the vertical temperature profile at 70˚ S latitude.
- Obtain the temperature data from Line C in Fig. 2.10. Determine the temperatures for each 250 m of depth.
- Connect the data points with a dotted line. Label the thermocline.
┬Ā
┬Ā
Activity Questions
- Compare the three vertical temperature profiles you created in Fig. 2.11.
- How are the vertical temperature profiles similar?┬Ā
- How are the vertical temperature profiles different?┬Ā
- Describe the thermocline in each of the profiles.
┬Ā
- How does the orientation of the earth relative to the sun help explain the variation in temperature profiles at the different latitudes?
┬Ā
- Toward the South Pole, the water layer at the surface is colder than the water layer just below the surface. How might this be explained? What would you predict about the density of the surface seawater?
┬Ā
- Do the water layers in the ocean appear well defined, or do they appear to mix readily? What is your evidence?┬Ā
┬Ā
┬Ā
Exploring Our Fluid Earth, a product of the Curriculum Research & Development Group (CRDG), College of Education. ® University of Hawaiįi, 2011. This document may be freely reproduced and distributed for non-profit educational purposes.


