Build your own rain gauge to collect and graph data to show the amount of rainfall where you live during different seasons (Fig. 2).
Materials:
2L bottle
(Note: another container can be used to capture rain, however the units of measurement need to be standard across gauges in the class so that students can compare!)
Scissors or bread knife (to cut the water bottle)
Binder clip for holding lid in place (optional)
Small rocks
Ruler
Permanent marker or paint pen
Student Worksheet and Teacher Answer Key (attached below)
This teacher guide follows the procedure written here and in the student worksheet with additional instructions and guidelines. We highly recommend starting this activity by introducing the Phenomenon, Inquiry, and Guiding Questions from the top of this webpage.
Extra collection data sheets for repetitive months (attached below):
The rain gauge can be checked as often as you desire. To look at rainfall patterns in a particular season, record rainfall once a week and graph the total rainfall each month for a few months (or enough to interpret the seasonal pattern).
A blank graphing sheet has been provided so you can compare rainfall data in different ways. Here are a few suggestions:
Rainfall over each day in a single month (see attached data sheet below),
Rainfall in different locations (if students have their own rain gauges at their house).
It will be helpful to do some graphing practice with students prior to this activity.
Procedure:
Build your own rain gauge to monitor your local rainfall and use the data collected to make a graph!
Image
Image caption
Fig. 2. Follow these steps to make a simple and recycled home-made rain gauge!
Image copyright and source
Image by Emily Sesno
Follow your worksheet to answer questions and build your rain gauge.
Before building your own rain gauge, think about these questions:
Where do you live?
When is it rainiest at your home?
What is the rain like on the other side of the island?
What month is it right now?
What season are you currently in?
Do you expect there to be a lot or a little rainfall in your given location this season? Explain.
Follow these steps to make a simple and recycled rain gauge!
If using a plastic water bottle, cut the neck on the cylindrical part where it begins to curve.
Note: Get help from your teacher to make this cut and if the edge is sharp, use tape to cover it so it is smooth.
Fill the bottom of the bottle with about a cup of small rocks.
Choose spot on the bottle just above the rock line to be your zero mark, or baseline. Draw a line in red.
Line the ruler up to the side of the bottle with the "0" in line with your baseline and mark up the bottle every 5 millimeters (mm). Label every other line (counting by 10).
Pour just enough water to cover the pebbles and so the water line is even with your zero mark.
Invert the top to make a funnel and use a binder clip if needed to secure the top. This funnel will direct the rainfall and prevent evaporation of water.
Place your gauge in a level area that will catch the rain (avoid placing the gauge under a tree or other covered area!).
Check the gauge once a week and record the rainfall on your data sheet.
(Note: If the value is hard to determine (in between values), use your ruler to help!)
Empty and reset it each time you take a reading.
(Note: To reset the gauge, empty the water, replace the rocks in the bottom of the bottle, and refill enough to reach your base line. Place it back on your chosen site.)
Graph your data!
After you have recorded data for each week in the month, add up each number to find the total amount of rainfall for that month.
Label the x-axis with the months you recorded (or will be recording) rainfall data.
Label the y-axis with rainfall in millimeters (mm). Be sure your scale is large enough that your rainiest months can fit on the graph!
(Note: some areas of the islands, such as the windward side, may get 500 mm of rain in a month! The leeward side may only get up to 100 mm.)
As you collect data each month, fill in your bar graph by drawing bars (that correspond to the month
on the x-axis) up to the appropriate rainfall total on the y-axis.
Observe the pattern in rainfall over time and answer the questions on page 5.
Activity Questions:
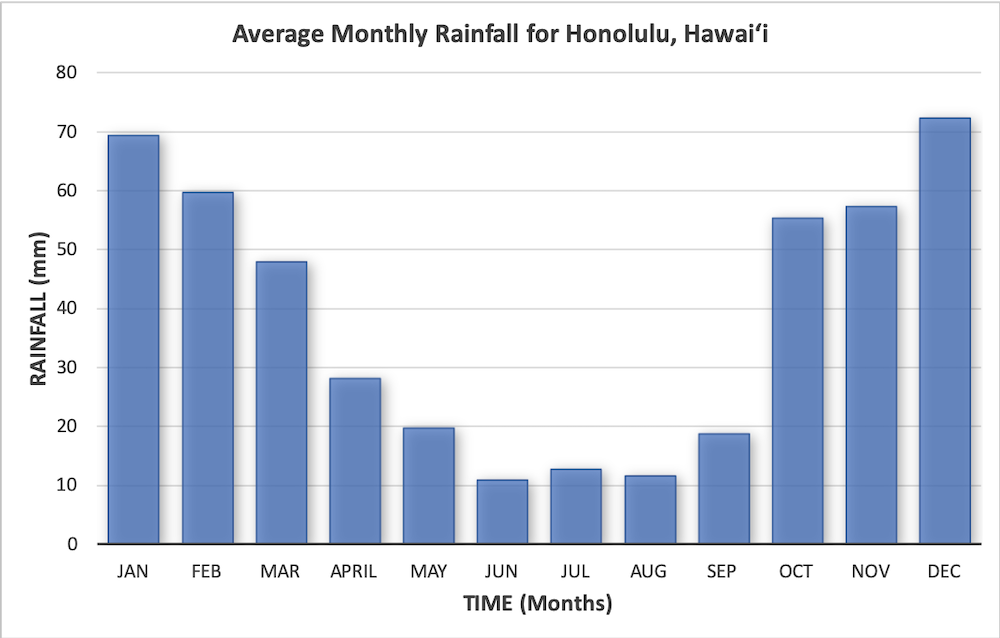
Using the graph in Fig. 1, when is the wettest and driest times of year?
Does your answer to number 1 make sense with your experience living in HawaiК»i?
What will you learn from recording one day of rain?
What will you learn from recording one year of rain?
What might be different in a rain gauge in your yard versus one in your classmates?
How can you improve the design of your rain gauge?
Why is it important to collect data on rainfall in different parts of the island?
Follow the link below for the activity modeling the wind and creating a cloud in a jar. These actvities help to solidify understanding of how the rain forms around the island.


")


")

